The first step in using ColorHOR graphical interface is setting the key-string(s) and subsequence lengths. For that task select the option KS Parameters in menu Data. Selecting that option a new window, with a list of key-strings and with a list of subsequence lengths, will appear. That lists could be modified: entry in the list could be added, deleted or modified.
There is possibility to enter several key-strings simultaneously. However only the key-string placed on the top will have effect. Default key-string is TGTTTC.
The list of subsequence lengths could contain several lengths simultaneously. The graphical interface will associate a certain colour stripe to each particular length. Default set of subsequence lengths is 65, 101, 232, 105, 106, 171, 402, 338,342,169. Right of the lengths you can obtain length distribution for the chosen KEY STRING as explained in the step 3.
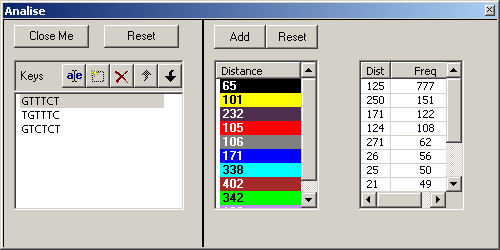 KS Parameters
The second step is importing a data; before importing data the key-string and the list of subsequence lengths have to be set (details in first step). To import the data use the option Import Fasta in the menu Data, and a new dialog window will appear. Select a data file for analysis, and press Open. The data file must be in fasta format.
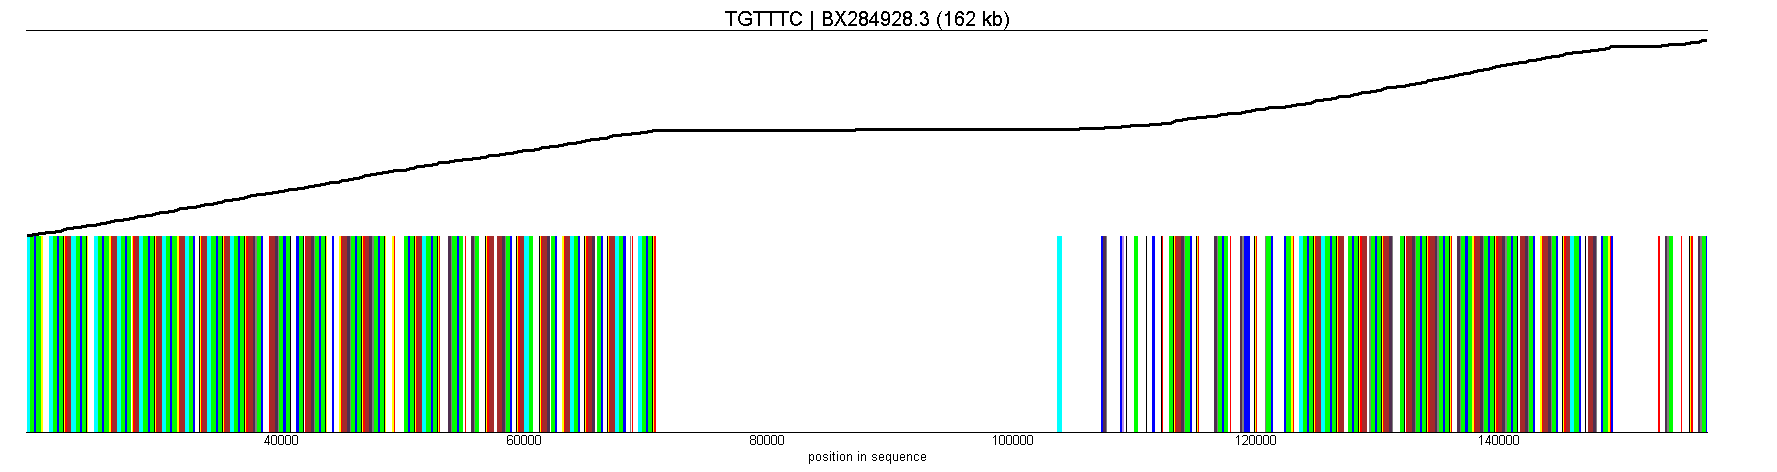
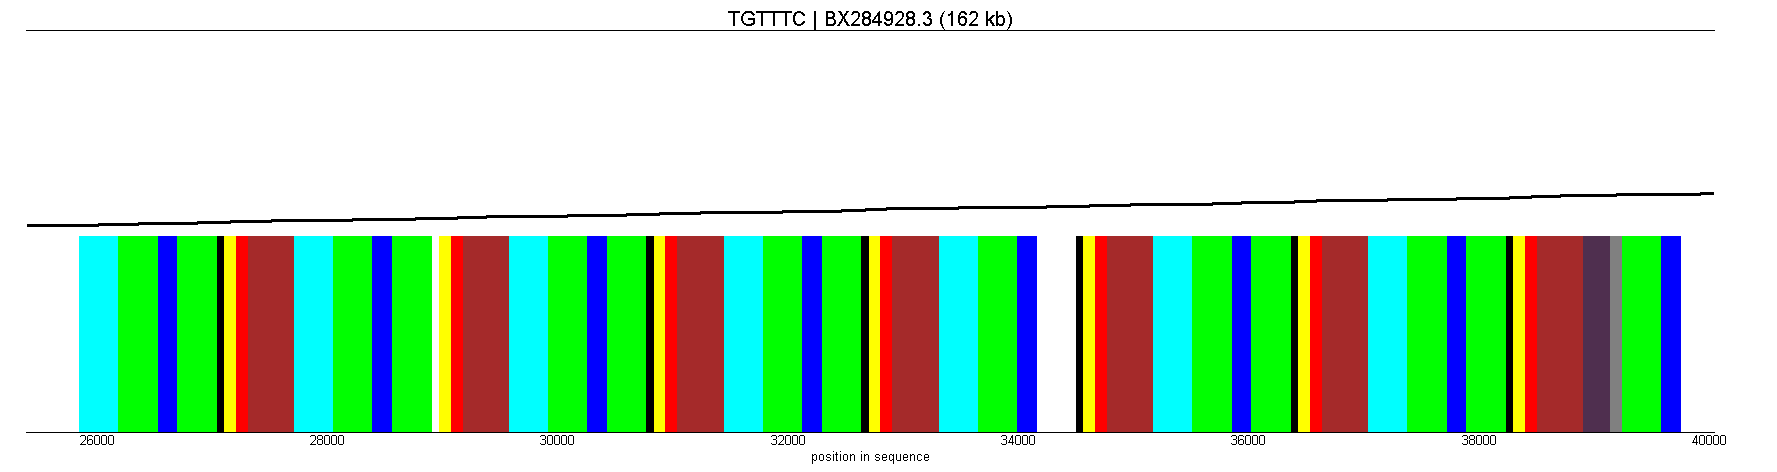
The third step is drawing the data. Here you have two possibilities: first
is "Plot/Density draw" to draw the KEY STRING distribution in the distances
space. It is very convenient first step since it is indicating what are the
lengths candidates for the given KEY STRING. It is advisable to have
"Data/KS Parameters" Analise panel opened since there you can find numerical
result sorted. This is the point where you can adjust appropriate lengths.
If you do so then you have to press "Data/Clear all sets" to clear the sets
and previous result and repeat reading and analysis from the previous step
(this is necessary because analysis is performed on the fly for efficacy
reasons). Now you can select the action "Plot/Stripes draw" and you see your
colored plot.
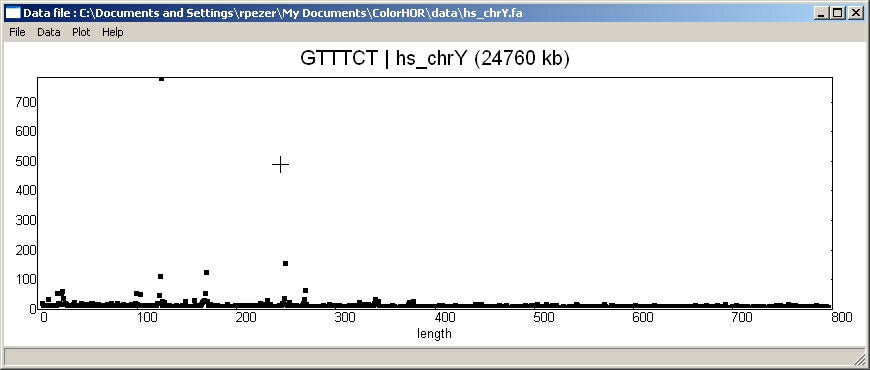 KEY STRING density distribution
for Y chromosome
KEY STRING density distribution
for Y chromosome
- zooming in
left mouse drag - zoom box.
- zooming out
right mouse click centered on the click location.
SHIFT + i - zoom in 50%
SHIFT + o - zoom out 50%
- coordinate and contig name
one left mouse click at the place of interest will
give an information about coordinate and contig name in
the bottom of the window.
- Clear the sets
SHIFT + c - clear all sets
Select the option Clear sets in menu Data, and repeat all steps from 1. to 3.
Example: colorHOR diagram of the test case
- Leave key-string and subsequence lengths unchanged
- Import the test sequence from the subfolder test (Full path is \Program Files\ColorHOR\test). The test sequence name is sequence.fa and contains clone AC017075.8 in fasta format.
- Select the option Data draw in menu Plot, and the colorHOR diagram will appear!
normal |
 |
zoom |
 |
Contact author: rpezer@phy.hr